Difference between revisions of "Report Viewer"
(→Audit History) |
|||
| (16 intermediate revisions by the same user not shown) | |||
| Line 4: | Line 4: | ||
[[File:reports2.png]] | [[File:reports2.png]] | ||
| + | |||
| + | |||
| + | ==Filtering Options== | ||
| + | |||
| + | There are various options available in the reports that will allow you to refine your searches. Which fields are available will depend on the report you have chosen but the filtering options are as follows: | ||
| + | |||
| + | |||
| + | '''Code:''' | ||
| + | Enter the code you are looking for to limit the results to only show this code. You can also use %value% to find codes that are 'like' the value you have entered. For example %003%. | ||
| + | |||
| + | [[File:filters1.png]] | ||
| + | |||
| + | |||
| + | '''Description:''' | ||
| + | |||
| + | Enter a description you wish to search for. You can also use %value% to find descriptions that are 'like' the value you have entered. For example %excavate% | ||
| + | |||
| + | [[File:filters3.png]] | ||
| + | |||
| + | |||
| + | '''Script Set:''' | ||
| + | |||
| + | Enter the script set you wish to search for. You can search for 'System' and 'Master' as well as the user created script sets. The %value% functionality will also work. | ||
| + | |||
| + | [[File:filters2.png]] | ||
| + | |||
| + | |||
| + | '''From''' and '''To''' | ||
| + | |||
| + | Allows you to specify a date range to limit your search to. | ||
| + | |||
==Standard Reports== | ==Standard Reports== | ||
| Line 97: | Line 128: | ||
[[File:reports16.png]] | [[File:reports16.png]] | ||
| + | |||
| + | ===Scripts=== | ||
| + | |||
| + | Lists the script, as seen by an operator, for a user specified topic and highlights the rows where there is a change of script. | ||
| + | |||
| + | [[File:reports22.png]] | ||
| + | |||
| + | ===Audit History=== | ||
| + | |||
| + | Report on how often results have been overridden by the operators. This report allows you to see instances where the priority has been overridden and the reason given. Also any time a tenant responsible repair has been logged as re-chargeable. | ||
| + | |||
| + | [[File:auditreport1.png]] | ||
| + | |||
| + | [[File:auditreport2.png]] | ||
| + | |||
| + | ==By Scriptpath Reports== | ||
| + | |||
| + | These reports are designed to report System and Master script references with a Script Set name of ‘System’ and ‘Master’ respectively. Rows will appear in the following sequence: | ||
| + | *System scripts, | ||
| + | *Master scripts then | ||
| + | *Set level Scripts alphabetically | ||
===Markers in Scripts by Scriptpath=== | ===Markers in Scripts by Scriptpath=== | ||
| Line 113: | Line 165: | ||
Lists all or user specified priorities and where they can be found within a script. | Lists all or user specified priorities and where they can be found within a script. | ||
| + | |||
| + | The Priorities report only displays and filters by priority description and does not allow filtering by code. | ||
[[File:reports19.png]] | [[File:reports19.png]] | ||
| Line 128: | Line 182: | ||
[[File:reports21.png]] | [[File:reports21.png]] | ||
| − | == | + | ==View Report== |
| + | After entering all required parameters click '''View Report''' to view the report with the new parameters. | ||
| − | + | ===The Menu Pane=== | |
| − | [[File: | + | *'''Refresh Report''' – click on the [[File:reports26.png]] icon to re-load data into the Report |
| − | + | *'''Zoom Control''' – click on the zoom drop down list and select a viewing level. | |
| − | + | ||
| − | Report | + | The viewing size of the Report can be enlarged or reduced by selecting from the drop down list in the zoom control. This does not affect the size when printing or saving the Reports to file. |
| − | |||
| − | |||
| − | [[File: | + | *'''Export''' – select the [[File:reports25.png]] icon to save the Report in a required format |
| − | ==Parameters== | + | ===Parameters=== |
Where a Report requires parameters to be set, they will be displayed in the Report Menu. | Where a Report requires parameters to be set, they will be displayed in the Report Menu. | ||
| − | + | '''Example''': [[File:158.png]] | |
| − | |||
| − | |||
| − | |||
| − | |||
| − | |||
| − | |||
| − | |||
| − | |||
| − | |||
| − | + | In this example you can select the ‘from’ date and the ‘to’ date; these will be defaulted to the previous calendar month. There are also other parameters that can be user defined and these include (but are not limited to) Script Set, User ID and Descriptions. | |
| − | |||
| − | |||
| − | + | [[File:159.png]] | |
| − | |||
| − | |||
| − | |||
| − | |||
===Changing Sorting order=== | ===Changing Sorting order=== | ||
| Line 171: | Line 209: | ||
Some Reports are designed so that data can be sorted by different elements. | Some Reports are designed so that data can be sorted by different elements. | ||
| − | Where this is available an icon | + | Where this is available an [[File:resort.png]] icon will appear in the column header. By clicking on the heading, the Report will re-sort itself by that column, alternating between alphabetical and reverse-alphabetical each time the header is clicked. The column header used for sorting will then contain up or down arrows. The example below shows the heading ‘Category’ being placed in a Sorting Order. You can sort by multiple columns by using the 'SHIFT' key and clicking additional icons. |
| + | |||
| + | [[File:165.png]] | ||
Latest revision as of 11:27, 19 March 2020
Contents
- 1 Dashboard
- 2 Filtering Options
- 3 Standard Reports
- 3.1 List of Markers
- 3.2 List of Messages
- 3.3 List of Priorities
- 3.4 List of Services
- 3.5 List of Tasks
- 3.6 Feedback
- 3.7 Order History
- 3.8 Summary by Category and Topic
- 3.9 Summary by User and Category
- 3.10 Summary of Markers Logged
- 3.11 Summary of Priorities Logged
- 3.12 Summary of Services Logged
- 3.13 Summary of Tasks Logged
- 3.14 User Information
- 3.15 Scripts
- 3.16 Audit History
- 4 By Scriptpath Reports
- 5 View Report
Dashboard
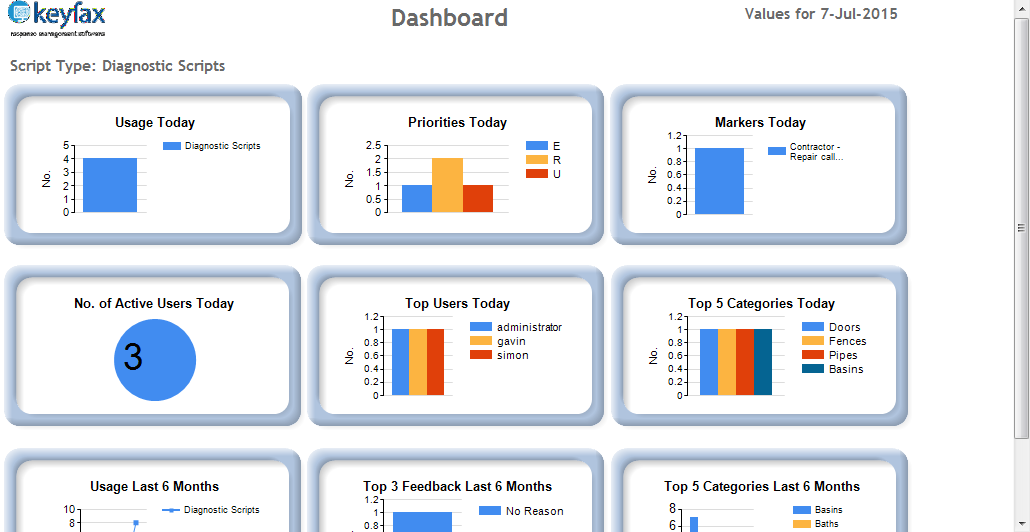
Shows a summary of the system on a user specified day together with a summary of the system for the previous six months from the day the report is run.
Filtering Options
There are various options available in the reports that will allow you to refine your searches. Which fields are available will depend on the report you have chosen but the filtering options are as follows:
Code:
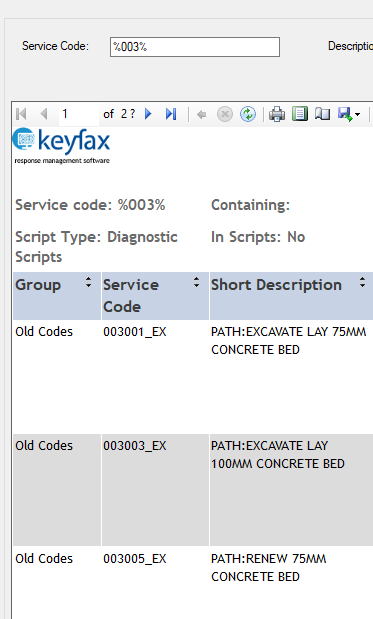
Enter the code you are looking for to limit the results to only show this code. You can also use %value% to find codes that are 'like' the value you have entered. For example %003%.
Description:
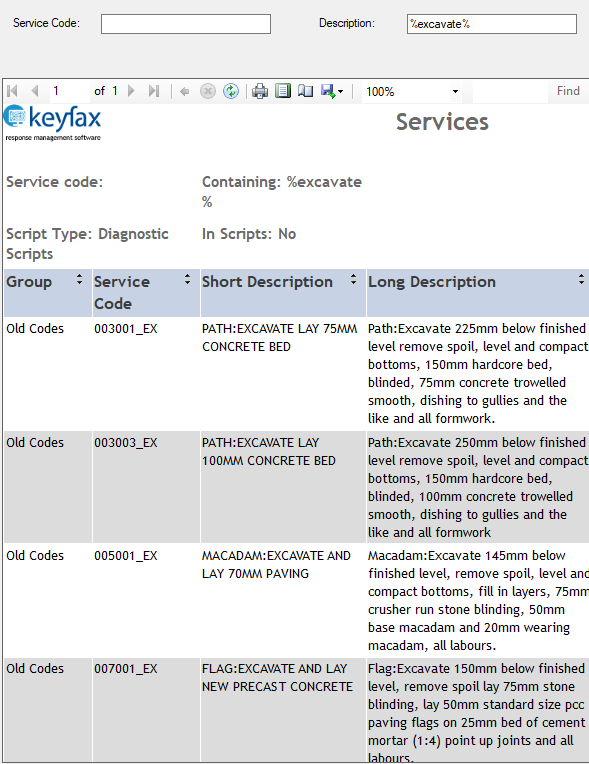
Enter a description you wish to search for. You can also use %value% to find descriptions that are 'like' the value you have entered. For example %excavate%
Script Set:
Enter the script set you wish to search for. You can search for 'System' and 'Master' as well as the user created script sets. The %value% functionality will also work.
From and To
Allows you to specify a date range to limit your search to.
Standard Reports
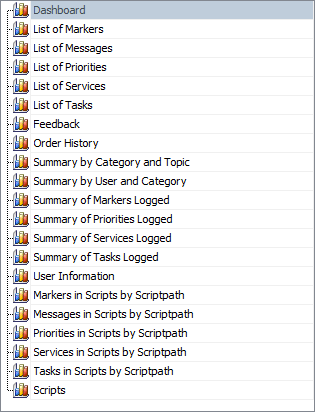
The following is a list all standard reports along with a brief description. Click on the report you are interested in to jump to the relevant section on this page.
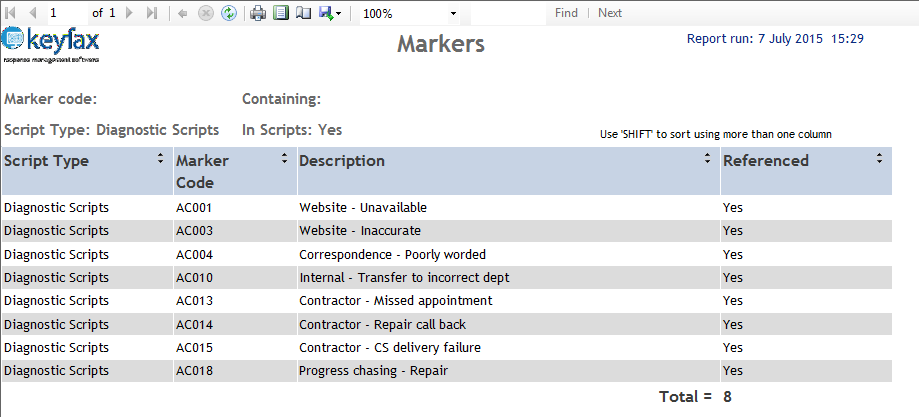
List of Markers
Lists all or user specified markers in a script type. The user can change whether to show markers that are referenced in scripts or not.
List of Messages
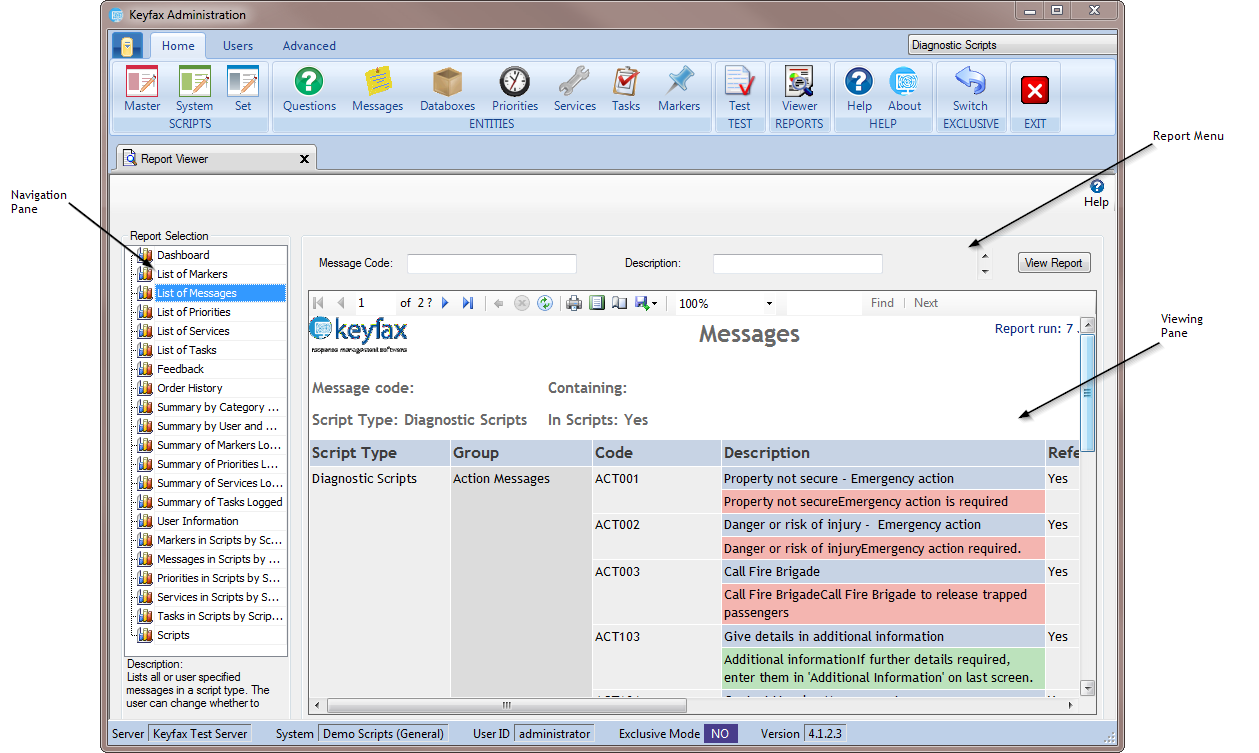
Lists all or user specified messages in a script type. The user can change whether to show messages that are referenced in scripts or not.
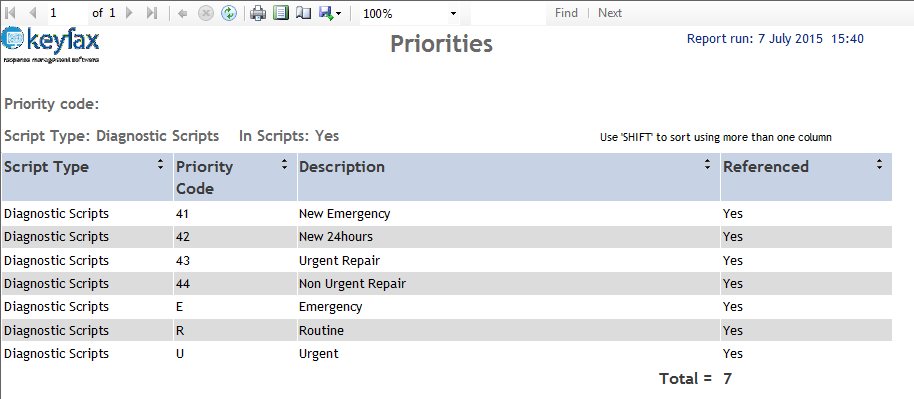
List of Priorities
Lists all or user specified priorities in a script type. The user can change whether to show priorities that are referenced in scripts or not.
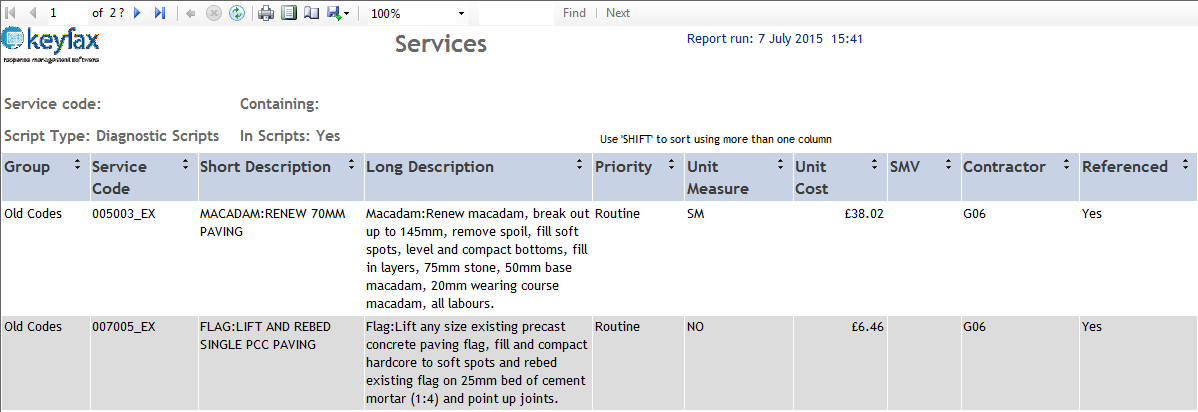
List of Services
Lists all or user specified services in a script type. The user can change whether to show services that are referenced in scripts or not.
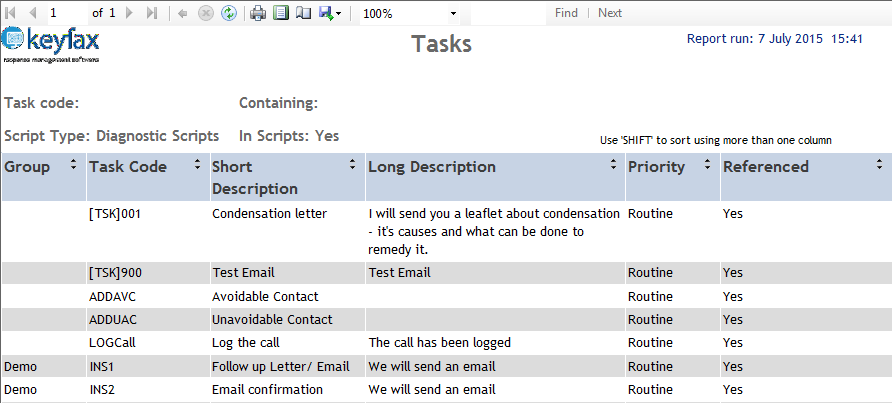
List of Tasks
Lists all or user specified tasks in a script type. The user can change whether to show tasks that are referenced in scripts or not.
Feedback
Lists all the feedback received within a user specified date range.
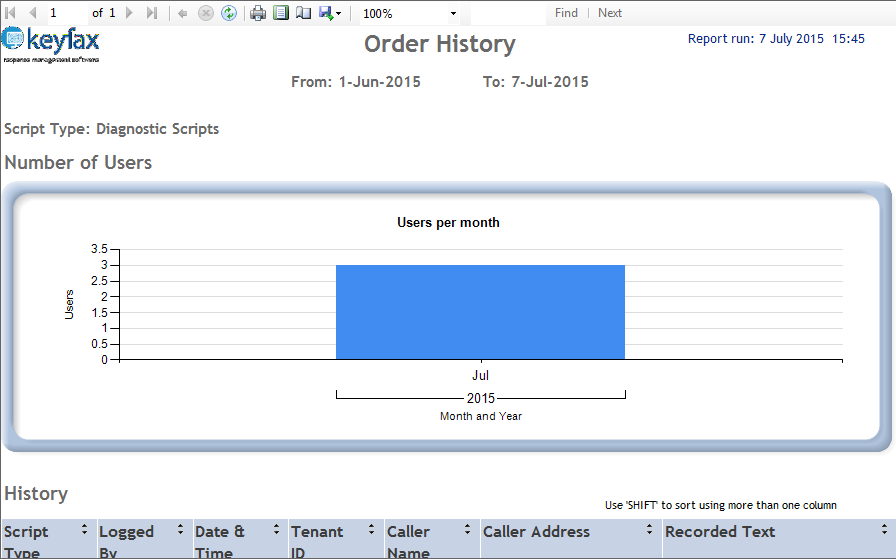
Order History
Shows the order history for a user specified date range, including the number of users per month.
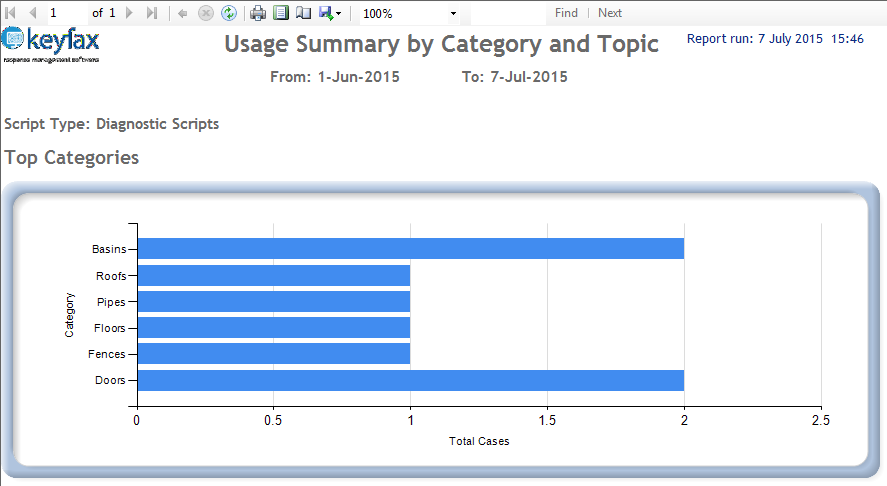
Summary by Category and Topic
Lists a summary of the usage by category and topic for a user specified date range alongside the top categories for that date range.
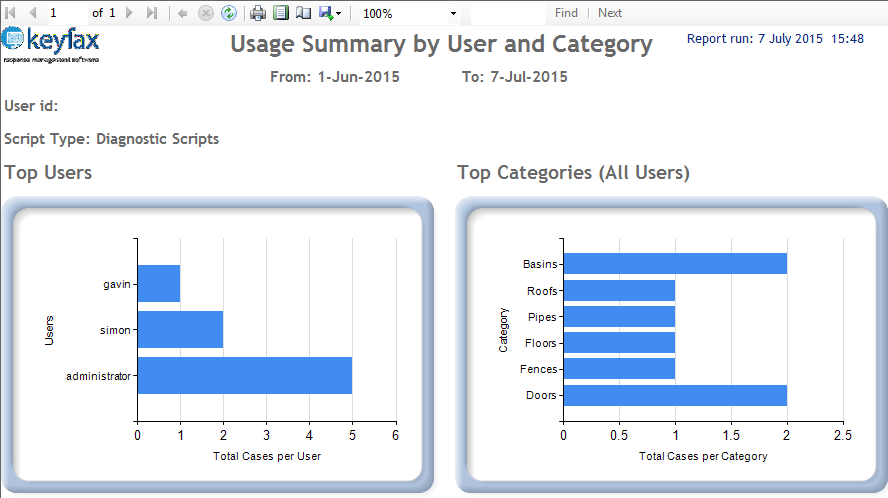
Summary by User and Category
Lists a summary of the usage by user and category for a user specified date range alongside the top users and top categories for that date range. The user shown can be changed.
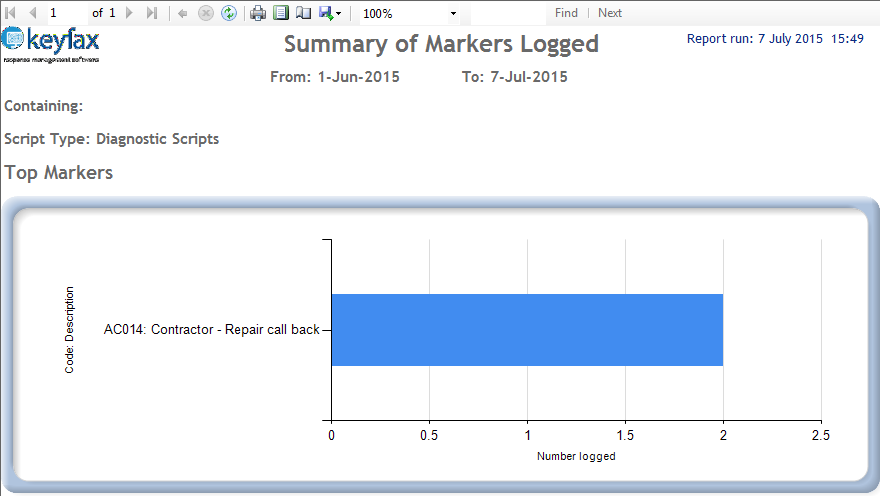
Summary of Markers Logged
Lists a summary of all or user specified markers logged within a user specified date range alongside the top markers logged for that date range.
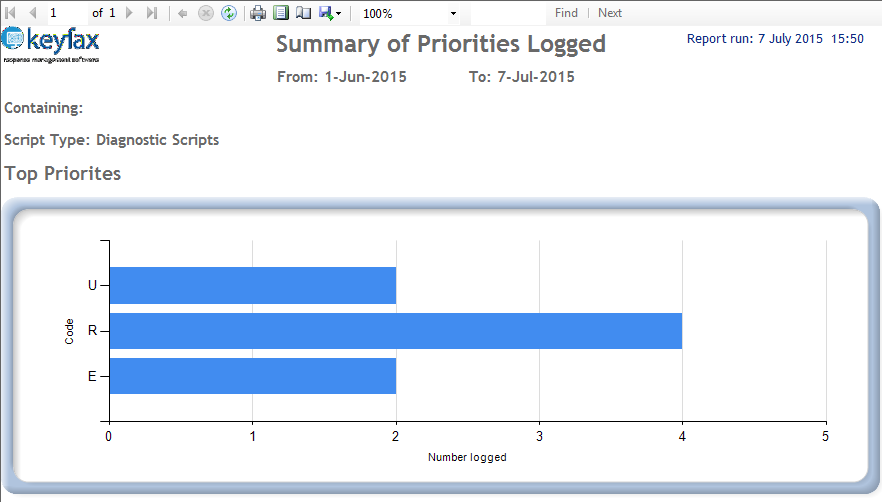
Summary of Priorities Logged
Lists a summary of all or user specified priorities logged within a user specified date range alongside the top priorities logged for that date range.
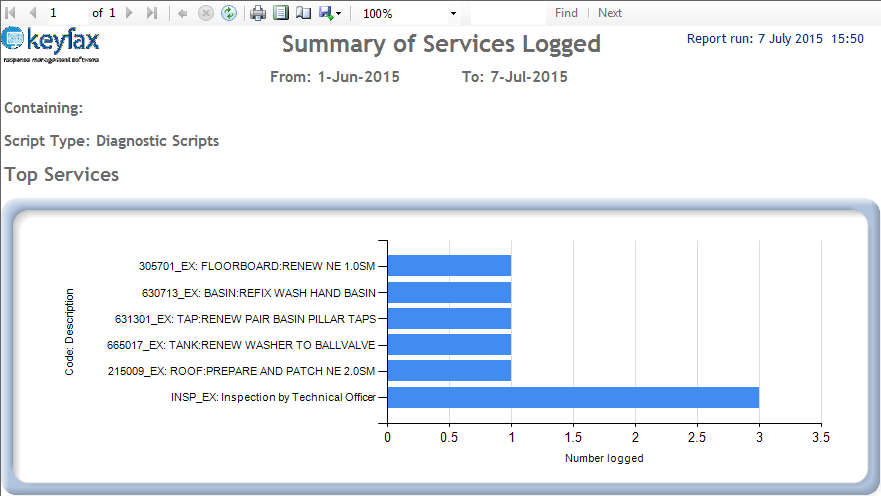
Summary of Services Logged
Lists a summary of all or user specified services logged within a user specified date range alongside the top services logged for that date range.
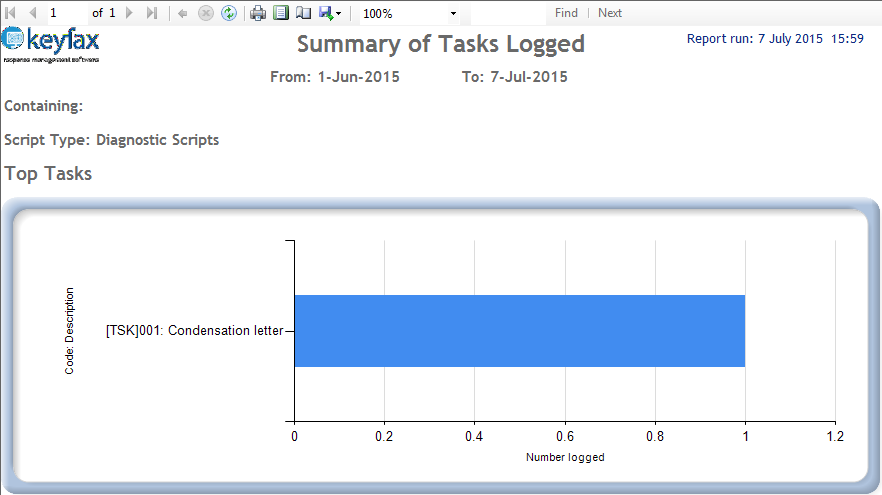
Summary of Tasks Logged
Lists a summary of all or user specified tasks logged within a user specified date range alongside the top tasks logged for that date range.
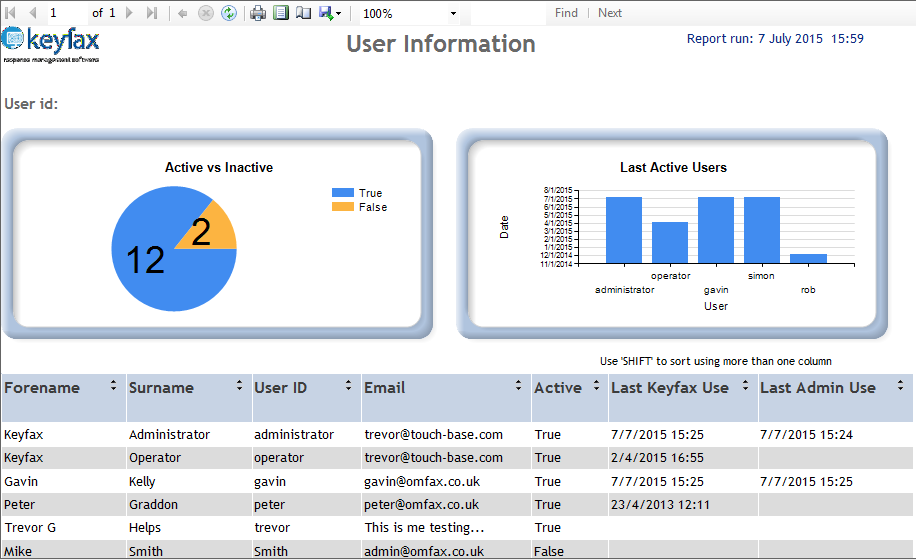
User Information
Shows all or user specified users of the Keyfax system alongside the number of active/inactive users and last five active users.
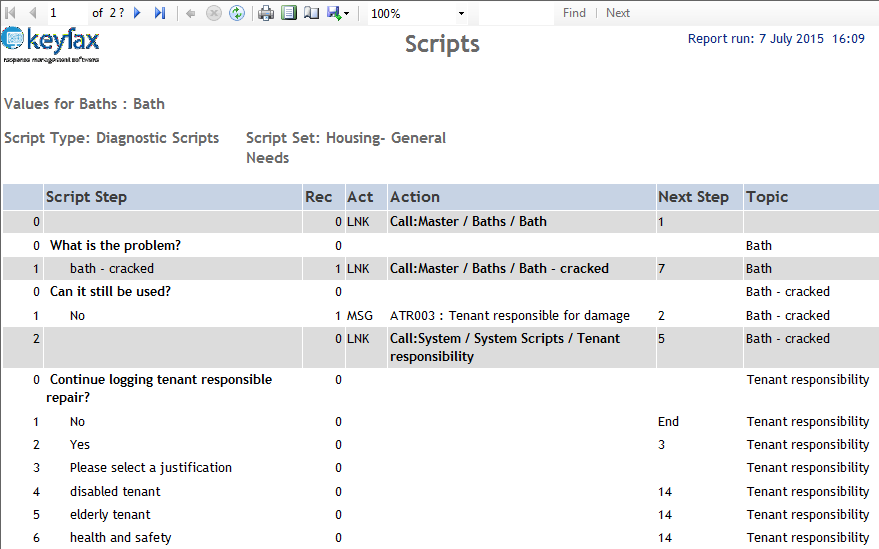
Scripts
Lists the script, as seen by an operator, for a user specified topic and highlights the rows where there is a change of script.
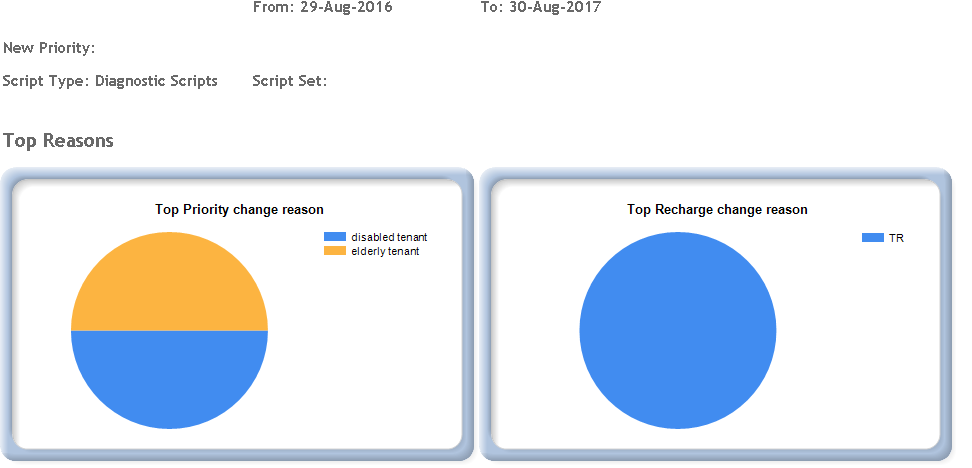
Audit History
Report on how often results have been overridden by the operators. This report allows you to see instances where the priority has been overridden and the reason given. Also any time a tenant responsible repair has been logged as re-chargeable.
By Scriptpath Reports
These reports are designed to report System and Master script references with a Script Set name of ‘System’ and ‘Master’ respectively. Rows will appear in the following sequence:
- System scripts,
- Master scripts then
- Set level Scripts alphabetically
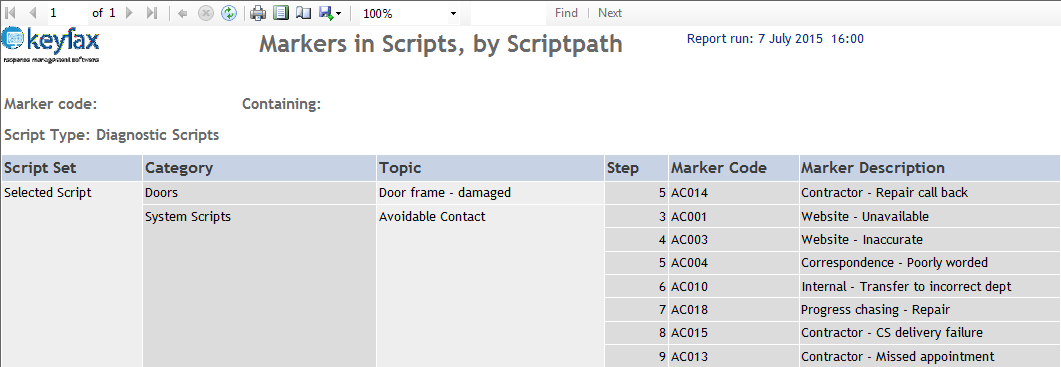
Markers in Scripts by Scriptpath
Lists all or user specified markers and where they can be found within a script.
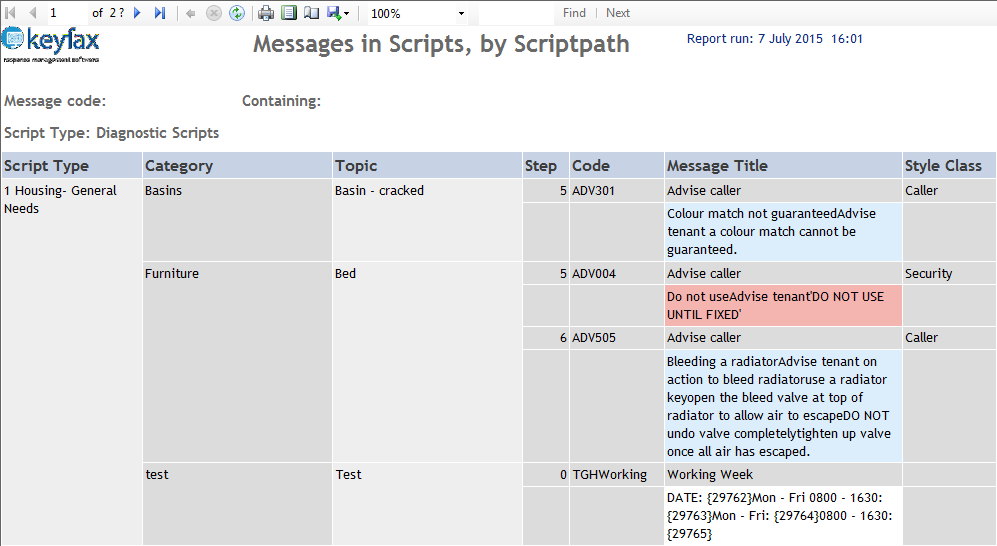
Messages in Scripts by Scriptpath
Lists all or user specified messages and where they can be found within a script.
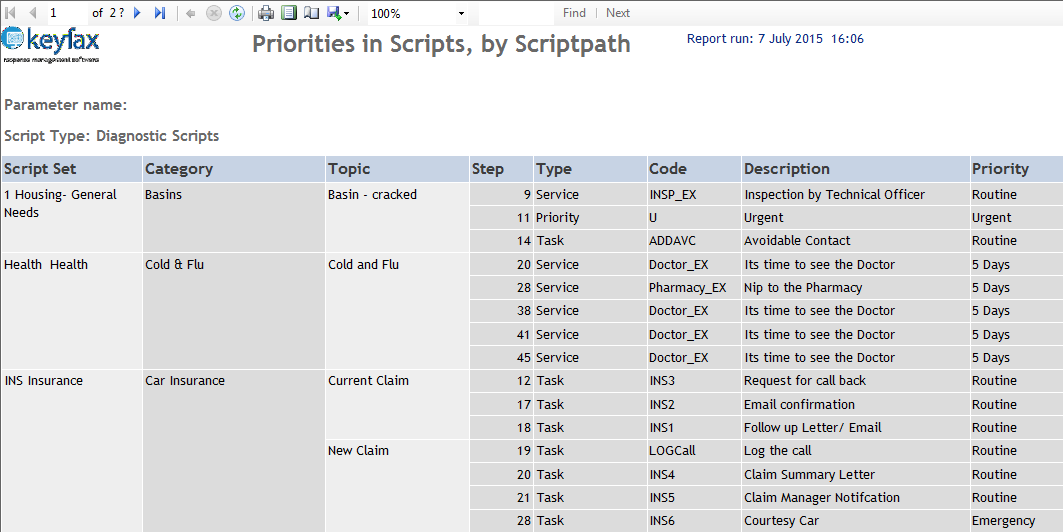
Priorities in Scripts by Scriptpath
Lists all or user specified priorities and where they can be found within a script.
The Priorities report only displays and filters by priority description and does not allow filtering by code.
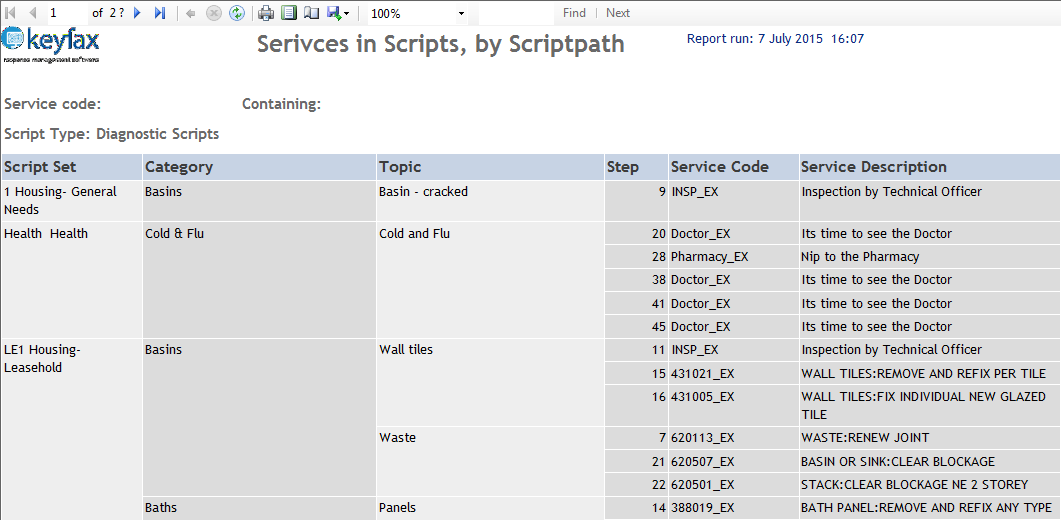
Services in Scripts by Scriptpath
Lists all or user specified services and where they can be found within a script.
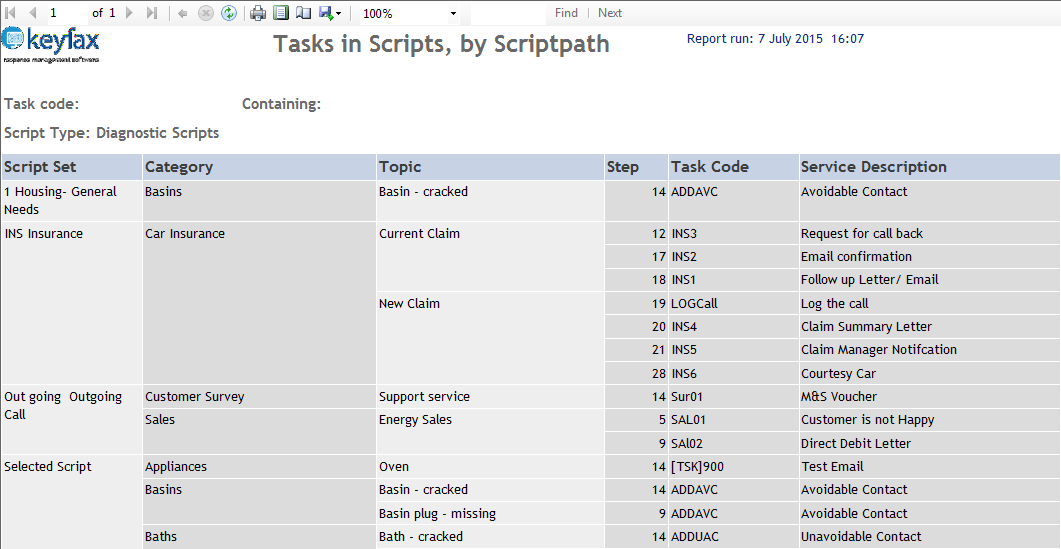
Tasks in Scripts by Scriptpath
Lists all or user specified tasks and where they can be found within a script.
View Report
After entering all required parameters click View Report to view the report with the new parameters.
The Menu Pane
- Zoom Control – click on the zoom drop down list and select a viewing level.
The viewing size of the Report can be enlarged or reduced by selecting from the drop down list in the zoom control. This does not affect the size when printing or saving the Reports to file.
Parameters
Where a Report requires parameters to be set, they will be displayed in the Report Menu.
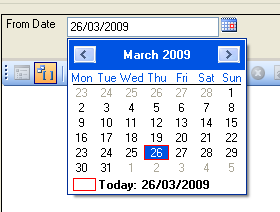
In this example you can select the ‘from’ date and the ‘to’ date; these will be defaulted to the previous calendar month. There are also other parameters that can be user defined and these include (but are not limited to) Script Set, User ID and Descriptions.
Changing Sorting order
Some Reports are designed so that data can be sorted by different elements.
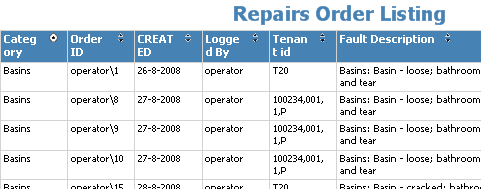
Where this is available an ![]() icon will appear in the column header. By clicking on the heading, the Report will re-sort itself by that column, alternating between alphabetical and reverse-alphabetical each time the header is clicked. The column header used for sorting will then contain up or down arrows. The example below shows the heading ‘Category’ being placed in a Sorting Order. You can sort by multiple columns by using the 'SHIFT' key and clicking additional icons.
icon will appear in the column header. By clicking on the heading, the Report will re-sort itself by that column, alternating between alphabetical and reverse-alphabetical each time the header is clicked. The column header used for sorting will then contain up or down arrows. The example below shows the heading ‘Category’ being placed in a Sorting Order. You can sort by multiple columns by using the 'SHIFT' key and clicking additional icons.
